Grafana pre-configured by Niles

About

Grafana is a privacy-focused web analytics platform crafted to deliver crucial insights into visitor behaviour while maintaining the highest standards of user privacy and data protection. Unlike traditional analytics tools that may use intrusive tracking methods, Fathom provides a streamlined and respectful approach to understanding web traffic.
Key Features
- Privacy-Centric Analytics
- Anonymous Tracking: Collect and analyse visitor data without infringing on privacy. Fathom does not use cookies or track personal information, ensuring complete user anonymity.
- Compliance: Adheres to major privacy regulations such as GDPR and CCPA, ensuring your analytics practices are fully compliant.
- User-Friendly Dashboard
- Intuitive Interface: Navigate a sleek, modern dashboard designed for ease of use, offering quick access to key metrics and insights.
- Customizable Reports: Tailor analytics reports to highlight the metrics that matter most to your business.
- Real-Time Analytics
- Immediate Insights: Access up-to-the-minute data on visitor behaviour, including page views, traffic sources, and user interactions.
- Simplified Metrics: View essential metrics without the clutter, enabling faster and more informed decision-making.
- Performance Tracking
- Visitor Insights: Monitor how visitors engage with your site, including time spent on pages and bounce rates, all while respecting their privacy.
- Conversion Tracking: Track key performance indicators (KPIs) and conversion rates to assess the effectiveness of your marketing strategies.
- Easy Integration
- Seamless Setup: Integrate Fathom with your website effortlessly using straightforward tracking codes.
- CMS and Platform Support: Compatible with major content management systems (CMS) and web platforms for a smooth implementation.
- Data Security
- End-to-End Encryption: Protect all collected and transmitted data with encryption to prevent unauthorized access.
- Data Retention: Retain data only for a limited period, focusing on valuable insights without unnecessary data accumulation.
- Minimal Impact on Performance
- Lightweight Code: The tracking code is optimized to have minimal impact on your website’s performance, ensuring fast load times and a smooth user experience.
- Customizable Alerts
- Performance Alerts: Set up alerts to notify you of significant changes in traffic patterns or key metrics, allowing for swift responses to emerging trends.
- Global Reach
- Multi-Language Support: Access the platform in various languages to cater to a global user base and ensure clear analytics reporting.
- Type virtual machines in the search.
- Under Services, select Virtual machines.
- In the Virtual machines page, select Add. The Create a virtual machine page opens.
- In the Basics tab, under Project details, make sure the correct subscription is selected and then choose to Create new resource group. Type myResourceGroup for the name.*.
- Under Instance details, type myVM for the Virtual machine name, choose East US for your Region, and choose Ubuntu 18.04 LTS for your Image. Leave the other defaults.
- Under Administrator account, select SSH public key, type your user name, then paste in your public key. Remove any leading or trailing white space in your public key.
- Under Inbound port rules > Public inbound ports, choose Allow selected ports and then select SSH (22) and HTTP (80) from the drop-down.
- Leave the remaining defaults and then select the Review + create button at the bottom of the page.
- On the Create a virtual machine page, you can see the details about the VM you are about to create. When you are ready, select Create.
It will take a few minutes for your VM to be deployed. When the deployment is finished, move on to the next section.
Connect to virtual machine
Create an SSH connection with the VM.
- Select the Connect button on the overview page for your VM.
- In the Connect to virtual machine page, keep the default options to connect by IP address over port 22. In Login using VM local account a connection command is shown. Select the button to copy the command. The following example shows what the SSH connection command looks like:
ssh azureuser@<ip>
- Using the same bash shell you used to create your SSH key pair (you can reopen the Cloud Shell by selecting >_ again or going to https://shell.azure.com/bash), paste the SSH connection command into the shell to create an SSH session.
Usage/Deployment Instructions
Connect to VM- Port- 22.
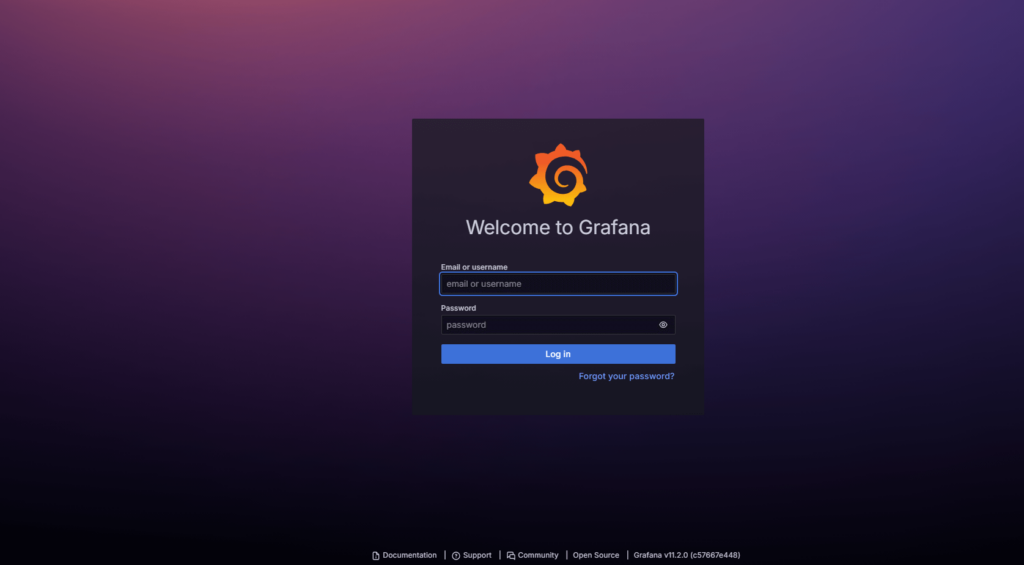
Step 2:Navigate to http:// instance-ip:3000/login.
Enter username and password
Username: admin
Password: admin
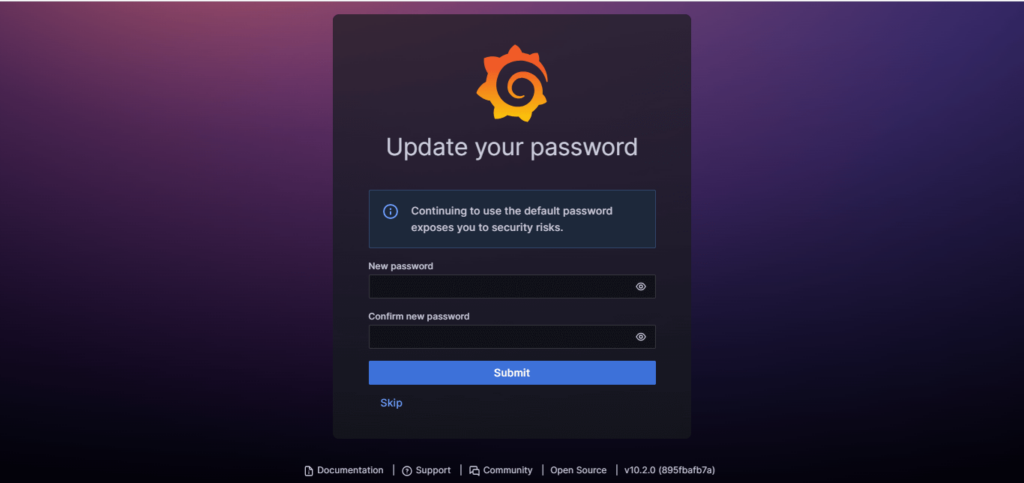
Step 3: You’ll be prompted to create a new password. Input a secure password, confirm it, and click the Submit button.
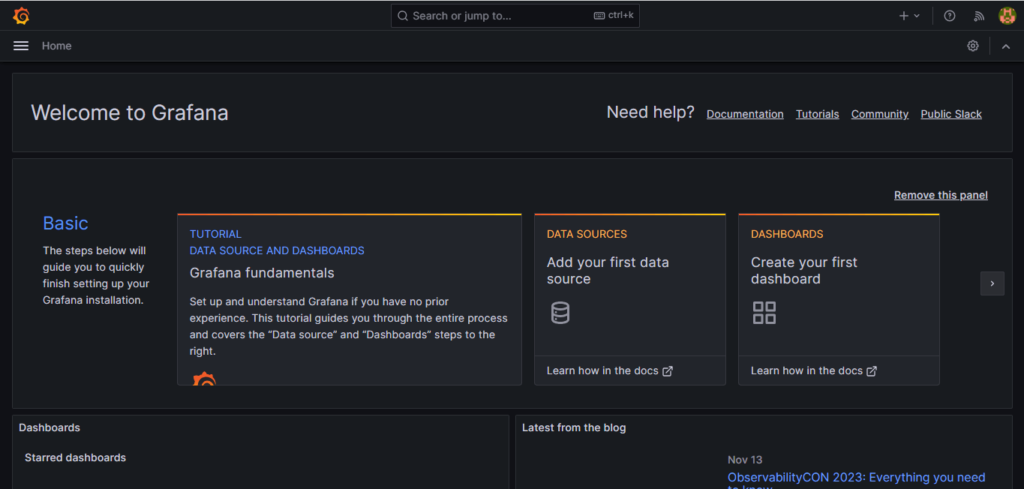
Step 4: You have successfully installed and configured Grafana. Now, You have all the access to Grafana’s dashboard.
- (510) 298-5936
Submit Your Request
Highlights
- Privacy-Centric Design
- User-Friendly Dashboard
- Real-Time Data
- Performance Tracking
- Easy Integration
- Data Security
Application Installed
